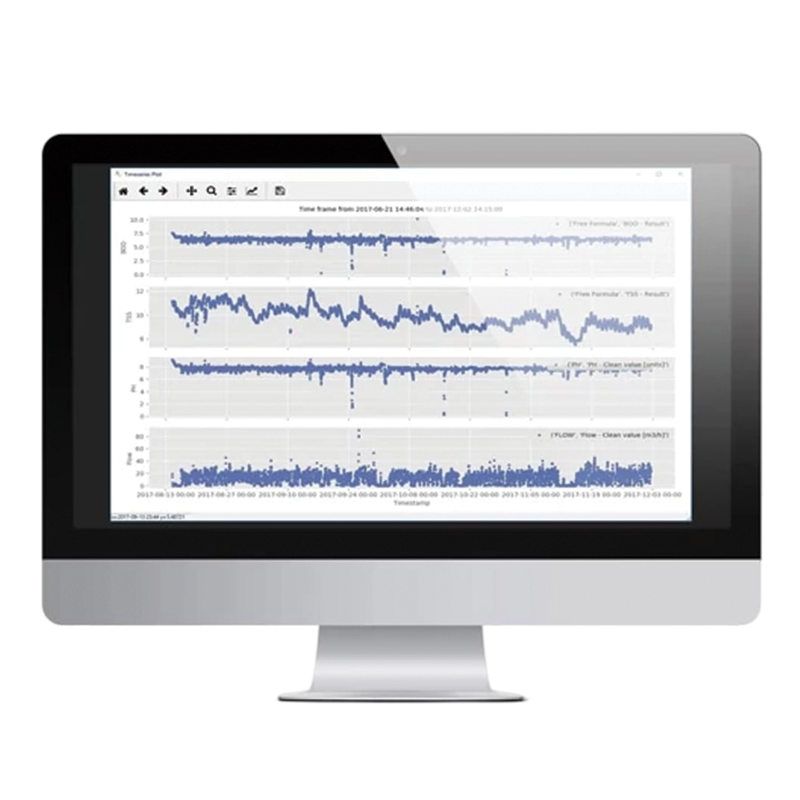
visu::tool is a fast and easy-to-use data visualization software for PCs and notebooks. In 3 simple steps, you can visualize huge amounts of data from con::cube or con::lyte into single or multiple graphs. The visu::tool “lyte” version is available for free download. The advanced visu::tool “pro” version includes a vast amount of additional useful offline features such as data aggregation, fingerprint plots, and parameter correlation and is now available for sale.
- Read s::can files (.log, .par, .csv, .xlsx, and .fp files)
- The graphical user interface for parameter selection
- Plot selected parameter or fingerprint data coming from your s::can probe
- Save data in Excel
- Create customized reports (sensor health report, drift detection, event detection)