
Author name: admin

Blogs, Continuous Emission Monitoring System (CEMS)

CEMS Installation Guide: A Step-by-Step Process for Industrial Plants

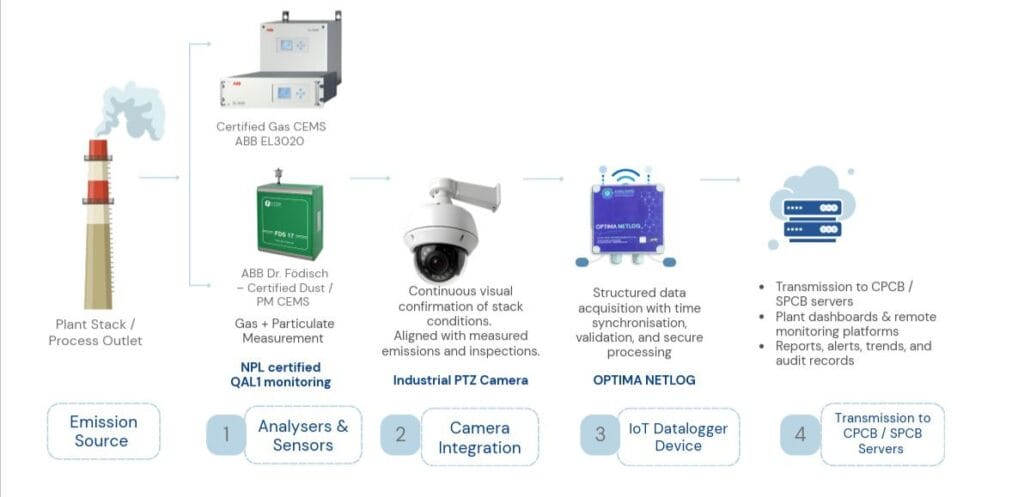
For industries operating boilers, furnaces, kilns, or process stacks, CEMS installation is now a regulatory necessity rather than an option. The Central Pollution Control Board (CPCB) and State Pollution Control Boards (SPCBs) require designated categories of highly polluting industries to install a continuous emission monitoring system and stream stack data online in real time. Beyond compliance, a correctly executed CEMS installation gives plant operators visibility into combustion efficiency, helps prevent penalties or closure notices, and builds a verifiable environmental record for audits, CSR reporting, and green certifications. This guide walks through the complete CEMS installation process, from planning to commissioning, so plant engineers and EHS teams know exactly what to expect. What Is a CEMS and Why Does CEMS Installation Matter for Industrial Plants? A Continuous Emission Monitoring System (CEMS) is an integrated set of instruments – gas analysers, particulate matter sensors, flow meters, and a data acquisition system – mounted directly on a stack or duct to measure pollutants such as SO2, NOx, CO, and particulate matter continuously, rather than through periodic manual stack sampling. CEMS installation matters because it replaces infrequent, manual snapshots with 24/7 emission data that is transmitted directly to CPCB and SPCB servers. For sectors like power generation, cement, steel, chemicals, and pharmaceuticals, this real-time visibility is the difference between catching a combustion upset within minutes and discovering a compliance breach weeks later during a routine inspection. A well-planned CEMS installation also reduces the manpower burden of manual stack testing and creates a defensible audit trail if regulators question emission performance. Pre-Installation Planning for a Successful CEMS Installation Every CEMS installation should begin with a detailed site assessment rather than jumping straight to equipment mounting. This planning phase typically includes: Stack survey: diameter, height, flow velocity, temperature, and access points to identify the correct monitoring location as per CPCB stack monitoring guidelines. Pollutant profiling: identifying which parameters (SO2, NOx, CO, O2, particulate matter, flow, opacity) are applicable to the specific industry category. Analyser selection: choosing extractive or in-situ analysers based on gas composition, moisture content, and dust load in the stack. Regulatory mapping: confirming CPCB/SPCB reporting formats, data transmission protocols, and applicable emission limits for the plant’s sector. Skipping this stage is the most common reason CEMS installation projects face rework later – an analyser sized or positioned incorrectly at this point can compromise data accuracy for years. Step-by-Step CEMS Installation Process Once planning is complete, a typical CEMS installation follows this sequence: Sampling port and probe installation: Ports are cut and welded at the identified stack location, following CPCB-recommended sampling plane distances from bends or obstructions. Analyser and sensor mounting: Gas analysers, particulate matter monitors, and flow sensors are installed either in-situ on the stack or in an adjacent analyser shelter for extractive systems. Sample conditioning system setup: For extractive CEMS, heated sample lines and conditioning units remove moisture and particulates before gas reaches the analyser. Cabling, power, and enclosure installation: Signal cables, power supply, and weatherproof enclosures are installed to protect equipment from vibration, heat, and dust. Data acquisition system (DAS) configuration: The DAS is connected to all analysers to log, average, and format data as required by CPCB’s online monitoring protocol. Network and telemetry integration: The DAS is linked via GPRS, leased line, or internet connectivity to the SPCB and CPCB servers for continuous data push. Each step in the CEMS installation sequence should be documented with photographs and commissioning checklists, since these records are often requested during SPCB inspections.  Calibration and Testing After CEMS Installation No CEMS installation is complete without calibration. Analysers are calibrated using certified zero and span gases to establish accuracy across the expected measurement range. Relative Accuracy Test Audits (RATA) or equivalent field verification are then conducted by comparing CEMS readings against a reference method, typically manual stack sampling performed simultaneously. Ongoing calibration is equally important – most CPCB guidelines require periodic zero/span checks and annual third-party calibration to keep the CEMS installation within tolerance limits. Plants should build a calibration calendar into their maintenance schedule rather than treating it as a one-time activity. Integrating CEMS Installation with CPCB/SPCB Online Servers A defining requirement of any CEMS installation in India is direct, tamper-proof data transmission to regulatory servers. This involves registering the plant and each analyser with the SPCB portal, configuring the DAS to transmit data at the mandated frequency (commonly every 15 minutes), and ensuring backup connectivity so data gaps are minimised during network outages.  Plants should also set up local dashboards so internal EHS teams can monitor the same data the regulator sees, enabling proactive correction before a limit exceedance is flagged externally. Common Mistakes to Avoid During CEMS Installation Choosing analyser technology without accounting for stack moisture, dust, or corrosive gas content. Placing sampling ports too close to bends, dampers, or flow disturbances, skewing readings. Treating calibration as a one-time activity instead of a scheduled maintenance task. Delaying SPCB/CPCB server integration until after physical installation, causing avoidable compliance gaps. Working with an experienced environmental monitoring partner for CEMS installation helps plants avoid these pitfalls, ensuring the system is accurate, compliant, and low-maintenance from day one. Choosing the Right Partner for CEMS Installation Because CEMS installation sits at the intersection of mechanical work, instrumentation, and regulatory reporting, plants benefit from working with a partner who can manage all three rather than coordinating separate vendors for probes, analysers, and DAS software. An experienced CEMS installation partner will also provide post-commissioning support – spare parts availability, annual maintenance contracts, and calibration services – so the system continues performing accurately well after the initial handover. Aaxis Nano has supported CEMS installation and commissioning across sectors such as cement, power, chemicals, and pharmaceuticals, combining global analyser technology with local field engineering and CPCB/SPCB server integration experience, so plants get a single point of accountability from planning through long-term upkeep. Conclusion A methodical CEMS installation – grounded in proper stack assessment, correct analyser selection, disciplined calibration, and reliable server integration – protects industrial plants from compliance risk while giving

Case Studies, News, PROJECT SPOTLIGHT, RTDAS—Real Time Data Acquisition System

Aaxis Nano Advances Flood Forecasting in Bhopal with Real-Time Reservoir Monitoring

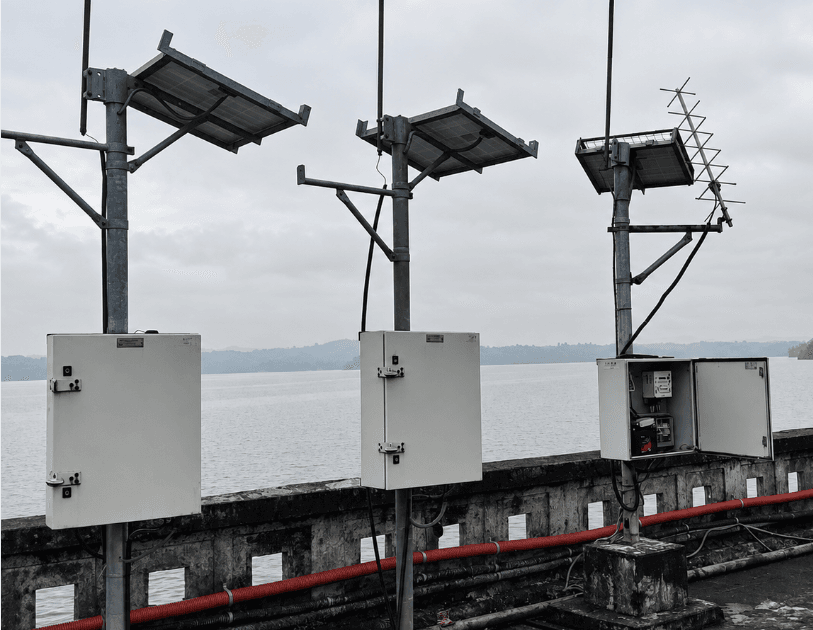
3 Locations across Narmada, Kolar. Surya river Aaxis Nano Advances Flood Forecasting in Bhopal with Real-Time Reservoir Monitoring 26 August 2026  |  Madhya Pradesh, India Under the National Hydrology Project, Aaxis Nano Technologies has commissioned telemetry-based Real-Time Data Acquisition Systems (RTDAS) for the Central Water Commission’s Narmada Division at Indira Sagar Reservoir in Khandwa, Kolar Reservoir in Sehore and Dhamni Dam in Palghar. The deployment provides hourly water-level and rainfall observations across the Narmada, Kolar and Surya river systems. Automated Water-Level & Rainfall Monitoring Each location combines a non-contact radar level sensor with an automated tipping-bucket rain gauge to measure water level and rainfall. An integrated data logger time-stamps, stores and prepares the measurements for transmission. Observations are recorded and communicated every hour, while onboard memory preserves field data during temporary connectivity interruptions. Dual-Path Data Communication INSAT satellite and GSM/GPRS channels operate in parallel, providing two communication routes for transferring data to the Central Water Commission’s monitoring and forecasting systems. Solar panels, batteries and charge controllers provide independent power, while weather-protected enclosures, surge suppression, grounding and lightning protection support dependable operation at exposed sites. Built for Long-Term Operational Continuity The project includes software integration, testing, commissioning, training and technical documentation, supported by a two-year comprehensive warranty followed by five years of maintenance support. Strengthening Flood-Forecasting Operations By connecting hourly water-level and rainfall observations with the Central Water Commission’s forecasting workflow, Aaxis Nano’s RTDAS provides timely and consistent inputs from three geographically dispersed locations. The deployment strengthens continuity between field measurements and hydrological assessment, supporting better-informed and more coordinated flood-forecasting operations. Aaxis Nano Technologies Pvt. Ltd. Environmental Monitoring | Water & Wastewater | Automation | Data & Digital Solutions

Case Studies, RTWQMS—Real Time Water Quality Monitoring System

Real-Time River Water Quality Monitoring Across Himachal Pradesh

11 Monitoring Locations Real-Time River Water Quality Monitoring Across Himachal Pradesh 21 August 2026  |  Himachal Pradesh, India Aaxis Nano Technologies commissions a Real-Time Water Quality Monitoring System (RTWQMS) for Jal Shakti Vibhag, Government of Himachal Pradesh, under the National Hydrology Project.  11 Monitoring Locations | 7 River Systems | Real-Time Monitoring Locations: Bhakra Dam • Paonta Sahib • Kullu • Mandi Town • Nadaun • Pong Dam • Lalpani • Solan • Rohru • Sainj • Chamba   Monitoring Across Challenging Terrain Assessing water quality across Himachal Pradesh’s mountainous terrain requires reliable field infrastructure, timely measurements and centralised data visibility. Aaxis Nano has deployed an IoT-enabled Real-Time Water Quality Monitoring System (RTWQMS) across strategically selected downstream locations covering the Satluj, Yamuna, Beas, Ashwani, Pabbar, Giri and Ravi river systems. Integrated Water Quality Monitoring The system combines UV-Vis spectrometry, ion-selective sensing, pH, dissolved oxygen and conductivity measurement, enabling monitoring of key parameters including COD, BOD, dissolved organic carbon, turbidity, colour, nitrate, ammonia, chloride, pH, dissolved oxygen, conductivity and temperature. Connected Data. Centralised Visibility. An IoT-enabled data logger supports sensor management, local visualisation, system control, data storage and transmission. Hourly readings are transferred to the Water Information Management System and the server hosted at the State Data Centre in Mandi Solar power, dedicated sampling arrangements and scheduled calibration and validation support dependable operation across remote locations. Supporting Better Water Quality Management By bringing data from geographically dispersed river stretches into a common digital framework, the network supports recognition of emerging changes, prioritisation of field investigations and comparison of conditions across catchments. Aaxis Nano Technologies Pvt. Ltd. Environmental Monitoring | Water & Wastewater | Automation | Data & Digital Solutions

Blogs, Water Quality Monitoring

UV Dose and Water Turbidity: Why Pre-Treatment Matters for Disinfection Performance

UV disinfection is often sold on its simplicity – no chemical dosing, no disinfection by-products, just a lamp and a reactor. But UV performance is far more sensitive to feed water quality than chlorination, and the single biggest variable that determines whether a UV system actually delivers its rated disinfection performance is turbidity. This piece breaks down the technical relationship between UV dose and turbidity, and why skipping pre-treatment is the most common reason UV systems underperform in the field. Understanding UV Dose: What mJ/cm² Means for Disinfection Efficiency UV dose, measured in millijoules per square centimetre (mJ/cm²), is the product of UV intensity (irradiance) and exposure time: Dose (mJ/cm²) = UV Intensity (mW/cm²) × Exposure Time (seconds) Regulatory and industry benchmarks (such as USEPA UV Disinfection Guidance and NSF/ANSI 55) typically require a minimum dose of 40 mJ/cm² for general municipal disinfection targeting bacteria and viruses, with higher doses (often 186 mJ/cm² or more) required for validated Cryptosporidium and Giardia inactivation. Every microorganism has a distinct dose-response curve – the dose needed to achieve a given log-reduction varies by pathogen type, which is why UV systems are validated for specific target organisms rather than treated as a universal disinfection guarantee. The critical engineering point: dose is only accurate if the UV intensity reaching the water is what the system assumes it is. Turbidity directly undermines that assumption. How Turbidity Affects UV Light Penetration and Disinfection Turbidity – suspended particles measured in Nephelometric Turbidity Units (NTU) – reduces UV transmittance (UVT) through water by absorbing and scattering UV-C light (254 nm wavelength, the germicidal range used by most low-pressure UV systems). As turbidity rises: UV Transmittance (UVT%) drops, meaning less UV light penetrates to the depth needed to reach microorganisms suspended deeper in the water column Effective dose delivered falls below the design dose, even though the lamp is operating at rated output Reactor hydraulics become less predictable, since particle-laden water can create uneven flow and dose distribution across the reactor A UV system designed and validated at 95% UVT can see disinfection performance drop sharply if actual feed water UVT falls to 80% or lower due to unmanaged turbidity spikes. The Science of UV Shadowing: How Particles Protect Microorganisms from UV Light Beyond simple light absorption, turbidity introduces a second, more insidious problem: UV shadowing. Suspended particles – clay, organic matter, iron floc – can physically embed or shield microorganisms from direct UV exposure. A pathogen lodged inside or behind a particle can pass through the UV reactor without receiving a lethal dose, even in water where bulk UVT appears acceptable. This is why turbidity control is not just about maintaining transmittance on paper – it’s about ensuring pathogens are actually exposed to the UV-C light path, not shielded by particulate matter travelling with them. Recommended Turbidity Limits for Effective UV Disinfection Most UV system manufacturers and disinfection guidelines recommend feed water turbidity be kept below 5 NTU, with many high-performance and drinking water applications targeting below 1 NTU for reliable, validated log-reduction performance. Above these thresholds, UV systems are typically rated for significantly reduced or unvalidated performance — meaning the disinfection claim itself becomes unreliable, not just less efficient.   Turbidity Range Expected UV Performance < 1 NTU Optimal — validated dose delivery reliable 1–5 NTU Generally acceptable for most municipal applications, monitor closely 5–10 NTU Degraded performance likely; pre-treatment strongly recommended > 10 NTU UV disinfection unreliable without pre-treatment; risk of shadowing and under-dosing Pre-Treatment Methods: Filtration, Coagulation, and Sedimentation Before UV Common pre-treatment approaches to bring turbidity within UV-acceptable range include: Media filtration (sand, multimedia, or cartridge filters) – the most common and cost-effective step ahead of UV for moderate turbidity feed water Coagulation and flocculation – for water with high suspended solids or colloidal turbidity that simple filtration alone won’t adequately reduce Sedimentation/clarification – for high-turbidity surface water sources, reducing bulk solids load before finer filtration Cartridge or bag filtration (typically 5–20 micron) – often used as a final polishing step immediately upstream of the UV reactor to protect against turbidity spikes and quartz sleeve fouling The right combination depends on source water characteristics – a borewell with occasional iron floc needs a very different pre-treatment train than a surface water intake with variable seasonal turbidity. Monitoring Turbidity and UV Dose in Real Time Because turbidity can spike unpredictably – especially with surface water sources or during high-flow events – static, one-time water quality testing isn’t sufficient for a UV system expected to perform continuously. A properly instrumented UV disinfection train includes: Inline turbidity sensors upstream of the UV reactor, providing continuous NTU readings UV intensity sensors (UVIS) inside the reactor itself, measuring actual delivered UV intensity in real time – not just assumed lamp output Automated interlocks that can trigger alarms, divert flow, or shut down disinfected-water delivery if turbidity or UV intensity falls outside validated operating range Data logging and telemetry to maintain an auditable compliance record showing dose was reliably delivered, not just assumed Consequences of Skipping Pre-Treatment: Reduced Efficacy and Compliance Risk Operating a UV system without adequate pre-treatment doesn’t just reduce disinfection margin – it can silently fail compliance while appearing to function normally. Lamps stay lit, flow continues, but delivered dose falls below the validated threshold without any obvious operational signal unless UV intensity and turbidity are actively monitored. For municipal utilities and regulated industrial dischargers, this translates directly into compliance risk during inspection or audit, and in the worst case, genuine public health exposure. Aaxis Nano’s UV Disinfection Systems with Integrated Turbidity Monitoring Aaxis Nano designs UV disinfection systems with turbidity and UV intensity monitoring built into the control architecture from the start, not bolted on as an afterthought. Our systems are engineered around actual source water characteristics-with the right pre-treatment train specified upfront – so the UV dose your system is rated for is the dose it actually delivers in continuous operation. Talk to our experts to evaluate your source water turbidity profile and design a

Case Studies, RTDAS—Real Time Data Acquisition System

From River Data to Flood Readiness: Aaxis Nano Advances Monitoring in West Bengal

19 Site automated river discharge measurement network From River Data to Flood Readiness: Aaxis Nano Advances Monitoring in West Bengal 19 August 2026  |  West Bengal, India Under the Ministry of Jal Shakti’s National Hydrology Project, Aaxis Nano Technologies has executed a 19-site automated river discharge measurement network for the Irrigation & Waterways Department, Burdwan. The system strengthens access to timely river information required for flood management, flow assessment and water-resource planning across West Bengal. Strengthening River Monitoring Across West Bengal Manual field observations can create delays between measurement and its availability to decision-makers, particularly during monsoon and high-flow periods. The deployed network covers key rivers and channels including the Mahananda, Fulahar, Bhagirathi, Barakar, Damodar, Ajoy, Rupnarayan and Mundeswari, with monitoring locations across Malda, Nadia, Bankura, Bardhaman, Hooghly, Howrah and adjoining districts. Automated, Non-Contact Discharge Measurement The system includes non-contact radar velocity sensors, radar water-level recorders, field data loggers, solar-power arrangements, batteries, protective enclosures and site-specific mounting structures. Using the velocity-area method, the equipment measures surface velocity and water level to calculate mean velocity, wetted cross-sectional area and volumetric discharge—without placing instruments directly within the watercourse. From Field Data to Centralised Operations A SCADA system brings pump status, water levels, alarms, operating trends and historical records onto a common interface. IoT-enabled communication transfers field information to the central platform, while integration with Patna’s Integrated Command and Control Centre (ICCC) enables city teams to supervise all nine locations from a single facility. The system is supported by a five-year comprehensive Annual Maintenance Contract, supporting continued availability and operational continuity. Supporting Flood Preparedness & Water-Resource Planning By connecting geographically dispersed gauging points with a central platform, the network creates a more reliable information base for understanding seasonal flow behaviour. The system supports the Jal Shakti Vibhag’s wider objectives of improving flood management, irrigation planning and evidence-based oversight of surface-water resources. Aaxis Nano Technologies Pvt. Ltd. Environmental Monitoring | Water & Wastewater | Automation | Data & Digital Solutions

Automation, Case Studies

From Pumping Stations to Centralised Operations: Aaxis Nano Advances Automation in Patna

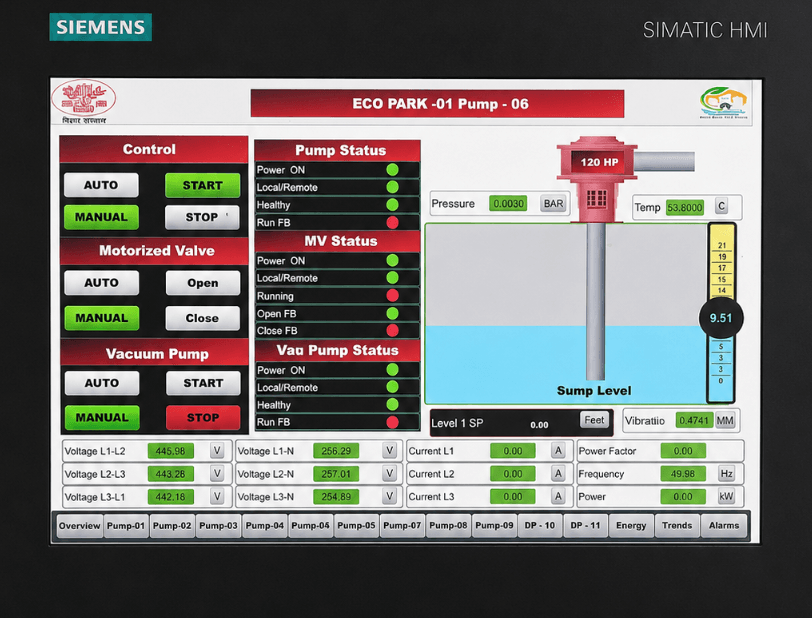
9 Drainage pumping stations From Pumping Stations to Centralised Operations:Aaxis Nano Advances Automation in Patna 17 August 2026  | Bihar, India Nine drainage pumping stations upgraded through PLC-based automation, field sensing, SCADA andcommand-centre integration. Heavy rainfall can rapidly raise water levels across Patna’s low-lying areas, placing drainage operations under immediate pressure. Aaxis Nano Technologies has modernised nine drainage pumping stations for Patna Smart City Limited across Yogipur, Yogipur NBCC, Saidpur, Pahari Old, Pahari New, Pahari NBCC and three Eco Park locations. Connected Pumping Infrastructure Together, the facilities comprise 62 pumps — 54 electrically operated and eight diesel-operated units. The deployment creates a connected framework for automatic pump control, equipment supervision and central visibility, reducing reliance on local manual intervention. Automated Monitoring & Control Radar level transmitters measure water levels, while pressure, vibration and temperature sensors provide information on pump and motor condition. Multifunction meters monitor electrical parameters and energy consumption. PLC panels apply predefined logic to start or stop pumps at specified water-level thresholds, while HMIs support local operation. Motor-operated gate valves and IP cameras further extend control and site visibility. From Field Data to Centralised Operations A SCADA system brings pump status, water levels, alarms, operating trends and historical records onto a common interface. IoT-enabled communication transfers field information to the central platform, while integration with Patna’s Integrated Command and Control Centre (ICCC) enables city teams to supervise all nine locations from a single facility. The system is supported by a five-year comprehensive Annual Maintenance Contract, supporting continued availability and operational continuity. Supporting Faster Response During Heavy Rainfall By linking field sensing, automatic control and central supervision, the deployment provides earlier visibility of equipment abnormalities and enables faster coordination during heavy rainfall.  Through this integrated system, Aaxis Nano supports timely stormwater removal, reduced dependence on on-site intervention and lower waterlogging risk across vulnerable areas.  Aaxis Nano Technologies Pvt. Ltd. Environmental Monitoring | Water & Wastewater | Automation | Data & Digital Solutions

Case Studies, Gas Monitoring

Gas Leak Detection Evolved: Aaxis Nano Introduces a One-of-a-Kind Vehicle-Based System

MOBILE GAS LEAK DETECTION SYSTEM Gas Leak Detection Evolved: Aaxis Nano Introduces a One-of-a-Kind Vehicle-Based System 12 August, 2026  | Maharashtra, India Aaxis Nano integrates gas sensing, location tracking, wind measurement and digital reporting into a specialised mobile survey unit for Mahanagar Gas Limited. Aaxis Nano Technologies has commissioned a specialised solution for Mahanagar Gas Limited to support the inspection of natural-gas distribution routes. Designed for use while driving, it helps field teams identify possible methane leaks, record their locations and conduct follow-up checks across operational areas. The mobile survey unit integrates an onboard power supply, bumper-mounted sampling inlet, roof-mounted anemometer, GPS/GLONASS antenna, communication modem and connected software. It measures methane and ethane concentrations while capturing position and wind data, allowing each field run to be mapped, reviewed and documented. ABB MobileGuard performs scanning while the vehicle is moving, and MicroGuard supports handheld confirmation at identified locations. Both instruments form part of the broader integrated solution. Field validation covered analyser response, satellite tracking, wind measurement, connectivity, live data collection and report generation. Trial surveys also confirmed the unit’s ability to record possible leak indications and support onsite verification. By combining gas sensing, location tracking, wind information and digital records in a field-ready arrangement, the project provides Mahanagar Gas Limited with a structured approach to route-based inspection. It also demonstrates the company’s ability to integrate specialised instrumentation into practical on-road applications that support field verification and informed maintenance planning.

Events

Aaxis Nano to Showcase Environmental Monitoring Solutions at Eco Sustain Expo 2026

ECO SUSTAIN EXPO 2026 Aaxis Nano to Showcase Environmental Monitoring Solutions at Eco Sustain Expo 2026 28 July 2026  | HITEX Hyderbad, India Advanced monitoring technologies for air, water, wastewater, greenhouse gases, and Industrial IoT, designed to enable smarter environmental management and sustainable industrial operations. Aaxis Nano Technologies Pvt. Ltd. will be participating in Eco Sustain Expo 2026, one of India’s leading exhibitions focused on environmental sustainability and industrial innovation. The event will be held from 30 July – 1 August 2026 at the HITEX Exhibition Centre, Hyderabad, where we will welcome visitors at Booth No. 2J12. The expo brings together environmental professionals, industries, government organizations, consultants, EPC companies, technology providers, and decision-makers to explore the latest advancements in environmental monitoring, automation, and sustainable infrastructure. Experiential Points Experience live demonstrations of our latest environmental monitoring technologies and see how they deliver accurate, real-time insights. Explore advanced solutions for monitoring water, wastewater, air quality, and greenhouse gas emissions across industrial and environmental applications. Discover Industrial IoT solutions that enable continuous monitoring, remote access, instant alerts, and centralized data management. Looking forward to connecting ideas, creating opportunities at Eco Sustain Expo 2026. Schedule a Meeting in Advance

News, OCU - Odour Control Unit, PROJECT SPOTLIGHT

Aaxis Nano to Advance Odour Mitigation at Delhi Jal Board’s Preet Vihar Sewage Pumping Station

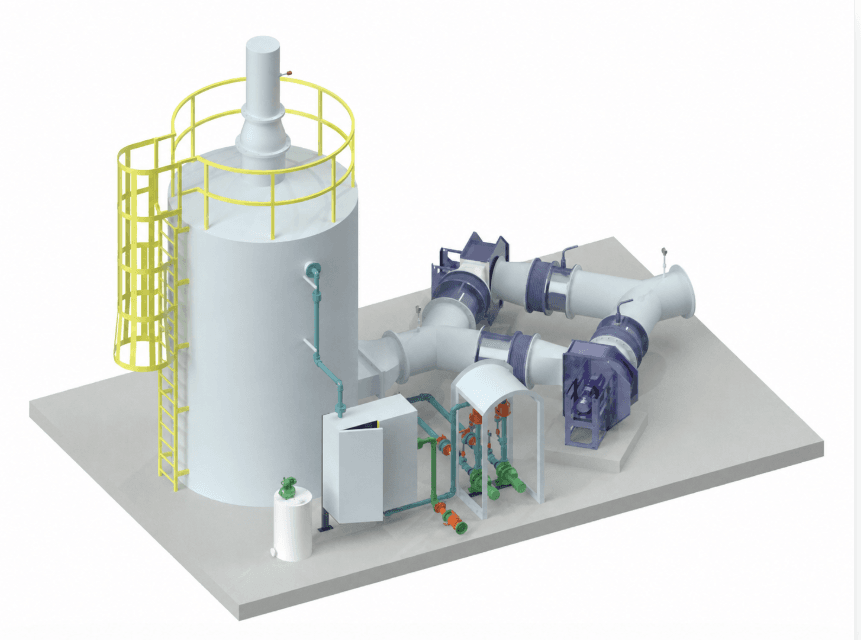
Odour Control Unit Aaxis Nano to Advance Odour Mitigation at Delhi Jal Board’s Preet Vihar Sewage Pumping Station 22 July 2026  | Delhi, India The 53.5 MGD pumping station will be equipped with H₂S surveillance and engineered odour treatment to reduce foul-smell impact around nearby residential areas. Delhi Jal Board’s Preet Vihar Sewage Pumping Station is set to upgrade its odour-control framework through the implementation of an Odour Control Unit by Aaxis Nano Technologies. Located near dense residential pockets, the project will support improved local environmental conditions, cleaner site operations and more controlled odour management around a key wastewater transfer facility. The proposed technology offering combines engineered odour capture, controlled air extraction, activated carbon-based filtration and online Hydrogen Sulphide (H₂S) measurement at critical points. Supported by instrumentation, control systems, commissioning and long-term operation and maintenance, the solution is designed to make odour mitigation more measurable, traceable and performance-driven. Once operational, it will help shift odour control at Preet Vihar from an invisible recurring concern into a monitored, managed and accountable environmental safeguard.

Case Studies, RTDAS—Real Time Data Acquisition System

Digital Hydrology Strengthens Water Governance in Madhya Pradesh

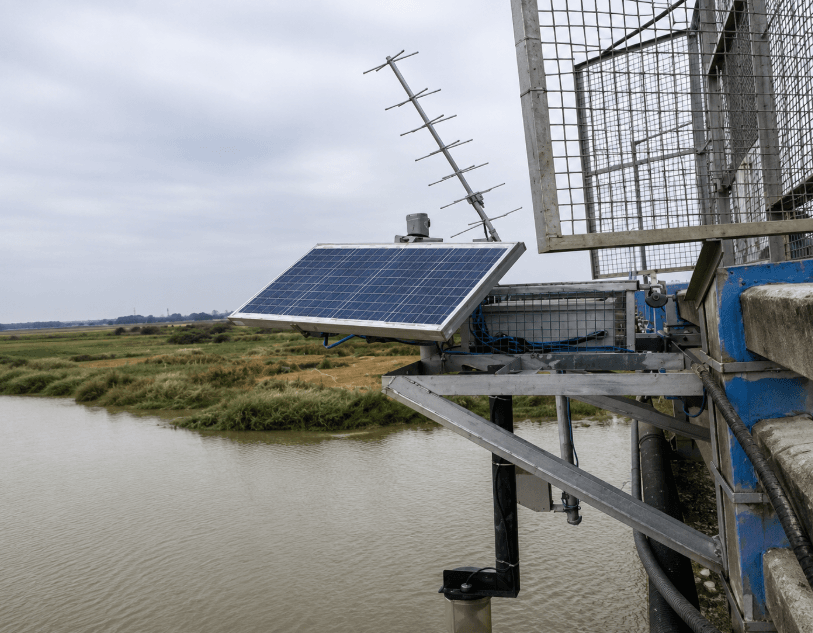
40 strategic monitoring locations across dams, rivers and stream sub-basins Digital Hydrology Strengthens Water Governance in Madhya Pradesh 20 July 2026  | Madhya Pradesh, India A unified Real-Time Data Acquisition System (RTDAS) strengthens Madhya Pradesh’s flood preparedness, planning and water-resource decisions. Madhya Pradesh’s water-resource management has gained a sharper digital layer under the World Bank-supported National Hydrology Project, with the Water Resources Department bringing critical dam, river and rainfall observations into a centralised monitoring framework. Enabled by Aaxis Nano Technologies through field instrumentation, telemetry and system integration, the network connects strategic locations to the Bhopal data centre, strengthening the state’s capacity for timely review, flood preparedness and coordinated decision-making. The project links 40 strategic monitoring locations across dams, rivers and stream sub-basins, responding to Madhya Pradesh’s growing need for dependable hydrological visibility amid climate variability, flood risk and rising water demand. By replacing fragmented reporting with a connected data framework, the system supports forecasting, operational review, planning and administrative decision-making with greater clarity. At the field level, the deployment includes Automatic Water Level Recorders and Automatic Rain Gauges for continuous measurement of water levels and rainfall. Supported by Yagi antennas, solar panels, data collection platforms, data loggers, tipping-bucket assemblies and protected station infrastructure, the setup is designed to maintain reliable performance across remote dam and river locations. For seamless data movement, the system uses GSM/GPRS and INSAT-based communication, allowing observations from dispersed sites to reach WRD’s central monitoring framework. Integration with the department’s e-SWIS platform enables visualisation, calibration, validation and wider access for Chief Engineer offices and key departments, strengthening coordination across the state’s water-management ecosystem. Backed by a five-year operations and maintenance commitment, the project reflects Aaxis Nano’s capability in combining instrumentation, telemetry and platform integration for large-scale hydrological governance. By converting scattered field readings into structured, decision-ready information, the initiative strengthens Madhya Pradesh’s preparedness for flood response, water planning and long-term resource resilience.

Scroll to Top