Author name: admin

Events

Aaxis Nano Recognized as Strategic Partner of the Year 2026 at Thermo Fisher Scientific Channel Partner Meet

Aaxis Nano Recognized as Strategic Partner of the Year 2026 At Thermo Fisher Scientific Channel Partner Meet 26 June 2026  |  Delhi, India We are proud to announce that Aaxis Nano Technologies Pvt. Ltd. has been honored with the prestigious Strategic Partner of the Year 2026 award at the Thermo Fisher Scientific Channel Partner Meet 2026 held in Lonavala. The award was received by Mr. Pranay Sood and Mr. Tejbir Singh, representing Team Aaxis on this remarkable occasion. This recognition reflects Aaxis Nano’s continued commitment to delivering innovative solutions, technical excellence, and customer-focused services across environmental monitoring, water infrastructure, industrial automation, and analytical instrumentation. The award highlights the strong partnership between Aaxis Nano and Thermo Fisher Scientific, built on a shared vision of advancing technology-driven solutions for industries and utilities. We extend our sincere gratitude to Thermo Fisher Scientific for this recognition and for their continued trust and collaboration. This achievement is a testament to the dedication, expertise, and hard work of the entire Aaxis Nano team. As we celebrate this milestone, we remain committed to driving innovation, strengthening partnerships, and creating lasting value for our customers and stakeholders. Together, we innovate. Together, we grow. Together, we lead.

Case Studies

Building a Real-Time View of Canal Operations Under the National Hydrology Project

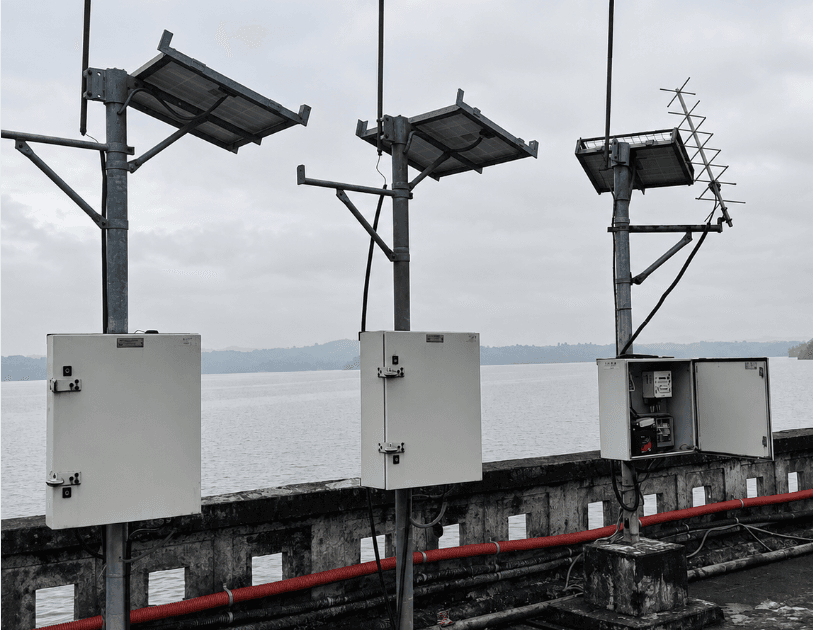
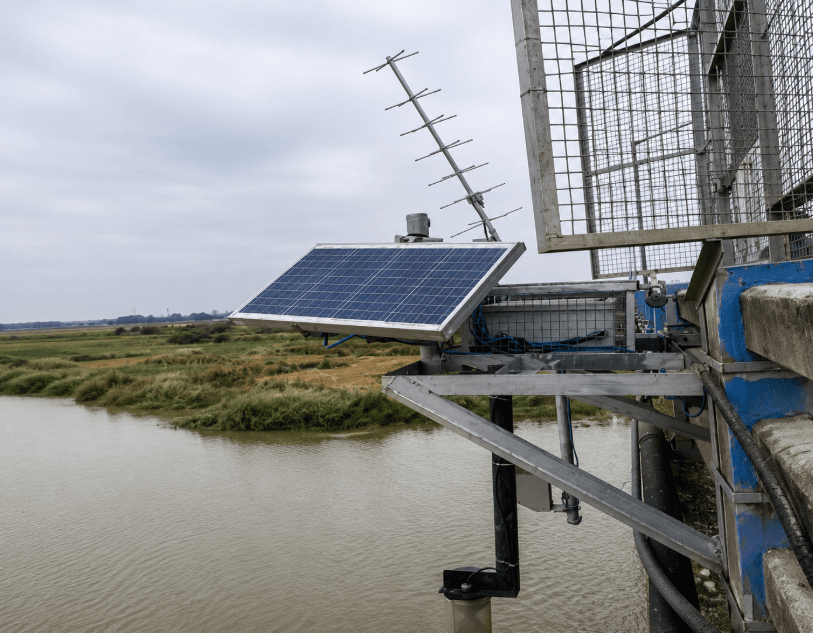
85 LIVE SITES Building a Real-Time View Hydrology Project of Canal Operations Under the National 24 June 2026  |  Delhi, India 85 monitoring locations equipped with advanced instrumentation and telemetry systems have been deployed across the Eastern Yamuna Canal network, providing real-time visibility into canal operations, water distribution, and irrigation management. Aaxis Nano has successfully implemented one of the region’s largest canal monitoring and telemetry networks under the National Hydrology Project (NHP), supporting the modernization of water resource management across the Eastern Yamuna Canal system under the Irrigation and Water Resources Department, Uttar Pradesh.A Real-Time Data Acquisition System (RTDAS) has been deployed at 85 key canal locations to track flow conditions and infrastructure performance continuously, supporting smoother operations and better water management. The network combines Acoustic Doppler Velocity Meters (ADVMs), water level sensors, gate position monitoring systems, Rain Gauge, GSM/GPRS telemetry, and centralized monitoring software to create digital ecosystem across the canal corridor. Supported by solar-powered field infrastructure, the deployment delivers instant access to discharge, water levels, gate operations, and rainfall conditions. Through IoT-enabled communication and centralized analytics, field data is transmitted to a unified monitoring platform, supporting irrigation scheduling, demand forecasting, GIS-based visualization, and evidence-based decision-making across the Eastern Yamuna Canal system.By transforming fragmented field observations into a connected digital monitoring platform, the RTDAS system enhances operational visibility, improves irrigation efficiency, strengthens water allocation planning, and supports informed management of one of Uttar Pradesh’s most important canal systems. Through this deployment, Aaxis Nano continues to contribute to the modernization of India’s water infrastructure and the advancement of hydrological intelligence at scale.

Groundwater Quality Monitoring
Blogs, Ground Water Monitoring

Groundwater Depletion vs. Contamination: Why Monitoring Differs

Groundwater Depletion vs. Groundwater Contamination: Why Monitoring Strategy Differs for Each Groundwater problems in India tend to get lumped into a single headline – “groundwater crisis” – but from an engineering and compliance standpoint, they are two separate problems that require two separate monitoring strategies. Groundwater depletion is a quantity problem: how much water is left, and how fast is it being drawn down. Groundwater contamination is a quality problem: what’s dissolved or suspended in the water that’s still there. Treating them as one problem, or monitoring for one while assuming it covers the other, is one of the most common design mistakes in industrial and municipal water compliance programs. This guide breaks down the technical difference, the parameters and instrumentation each requires, and how to structure a monitoring network that actually covers both. What Is Groundwater Depletion? Causes and Key Indicators Groundwater depletion refers to a sustained decline in the water table due to extraction rates exceeding natural or artificial recharge. In India, this is driven primarily by agricultural pumping, urban borewell proliferation, and reduced recharge from paved surfaces and reduced monsoon infiltration. Key indicators tracked in a depletion-monitoring program include: Static water level (SWL) – the depth to water when no pumping is occurring, typically measured in meters below ground level (mbgl) Dynamic/pumping water level – the drawdown level during active extraction, used to calculate specific capacity Rate of decline (m/year) – trended over multiple years to identify aquifers approaching critical stress Recharge rate – estimated from rainfall infiltration data and cross-referenced against extraction volumes None of these parameters says anything about whether the water is safe to drink or use industrially – which is exactly why depletion monitoring and contamination monitoring require different sensor sets. What Is Groundwater Contamination? Common Sources and Pollutants Groundwater contamination refers to the presence of chemical, biological, or physical pollutants at concentrations that exceed permissible limits for drinking, agricultural, or industrial use. Common sources in the Indian context include: Geogenic contamination – naturally occurring fluoride, arsenic, and iron leaching from bedrock, especially prevalent in central and southern peninsular India Agricultural runoff – nitrate from fertiliser overuse, a major contributor to groundwater nitrate levels in Punjab, Haryana, and parts of UP Industrial effluent seepage – heavy metals, hydrocarbons, and organic compounds from unlined effluent pits or leaking underground storage Sewage infiltration – coliform and pathogenic contamination in areas with unlined soak pits near shallow aquifers Quantity vs. Quality: Why the Two Problems Need Different Monitoring Approaches Aspect Depletion Monitoring Contamination Monitoring What’s measured Water level (mbgl) Chemical/biological parameters (TDS, nitrate, fluoride, coliform) Primary instrument Pressure transducer / piezometer Multi-parameter water quality probe Data frequency Often adequate at daily/weekly intervals Often requires continuous or high-frequency sampling, especially near contamination sources Regulatory driver CGWA extraction norms, Atal Bhujal Yojana CPCB/BIS drinking water standards, industrial NOC conditions Failure mode if ignored Aquifer collapse, land subsidence, dry borewells Health hazards, regulatory penalties, loss of usable water source A facility that only tracks water level compliance can still be sitting on a contaminated aquifer without knowing it — and vice versa. A complete monitoring strategy runs both in parallel, often on the same physical borewell network but with distinct instrumentation stacks. Sensors and Parameters for Depletion Monitoring (Water Level, Piezometers, Recharge Rate) A standard depletion-monitoring network is built around: Piezometers fitted with submersible pressure transducers for continuous static/dynamic water level logging Telemetry units (GSM/GPRS/cellular) to push readings to a central dashboard without manual site visits Rain gauge integration to correlate recharge events with water level recovery Automated alerting when water levels cross a defined critical threshold, often tied to CGWA reporting obligations Sensors and Parameters for Contamination Monitoring (TDS, Nitrate, Fluoride, Heavy Metals) A contamination-monitoring network is built around a different instrumentation stack: TDS/conductivity sensors for a first-pass indicator of dissolved mineral load Ion-selective electrodes (ISE) for nitrate and fluoride — the two most widespread contaminants in Indian groundwater pH and ORP probes to flag chemical imbalance or industrial seepage Turbidity sensors where surface infiltration or sediment intrusion is suspected Periodic lab-verified sampling for heavy metals and microbiological parameters that real-time sensors cannot yet reliably capture continuously Regulatory Framework in India: CGWA Norms and Atal Bhujal Yojana The Central Ground Water Authority (CGWA) regulates groundwater extraction through No Objection Certificates (NOCs) for industrial and infrastructure projects, with conditions often mandating installation of piezometers and periodic water level reporting. The Atal Bhujal Yojana (ABY), a central government scheme, pushes community-level groundwater monitoring and management in water-stressed districts, and increasingly expects digitized, telemetry-based reporting rather than manual gauge readings. Separately, water quality compliance for industries typically falls under state Pollution Control Board conditions and BIS IS 10500 drinking water standards – a distinct regulatory track from CGWA’s extraction-focused mandate. How to Choose the Right Monitoring Strategy for Your Site or Facility A practical framework for deciding where to invest monitoring budget: Industrial sites near effluent handling areas – prioritise contamination monitoring; depletion is secondary unless extraction volumes are also high High-extraction agricultural or municipal supply zones – prioritise depletion monitoring with automated water-level telemetry Sites with both high extraction and contamination risk (common in industrial clusters) – a combined network is non-negotiable; regulators increasingly expect both data streams from a single site Aaxis Approach/Solution Aaxis Nano designs groundwater monitoring networks according to the specific risks and regulatory requirements of each site. Depletion-focused systems integrate digital water-level recorders, pressure-based level sensors, data loggers and telemetry to continuously track groundwater levels, drawdown, recovery and long-term aquifer trends.For contamination-focused monitoring, multi-parameter instruments can measure selected in-situ indicators such as temperature, pH, electrical conductivity, dissolved oxygen, ORP and turbidity. Contaminant-specific parameters may additionally require periodic sampling and laboratory analysis. In combined networks, continuous field measurements and verified laboratory results can be consolidated through a common data platform for trend assessment, threshold alerts and reporting.Using proven groundwater monitoring instrumentation from technology partners – In-Situ, OTT HydroMet and Sommer Messtechnik, Aaxis Nano provides system engineering, installation, commissioning, telemetry integration, dashboard configuration, and lifecycle support across

News

Aaxis Nano to Deploy DPCC’s Next-Generation Water Quality Monitoring Network

41 Online Monitoring Stations Across Delhi’s Rivers & Drains Aaxis Nano to Deploy DPCC’s Next-Generation Water Quality Monitoring Network 22 June 2026  |  Delhi, India 41 field installations equipped with advanced sensors and instrumentation will be deployed across rivers and drains, strengthening continuous water quality surveillance, environmental intelligence, and data-driven decision-making across the capital. Aaxis Nano has been entrusted with one of Delhi’s most significant environmental infrastructure initiatives to date the deployment of a 41-station monitoring network spanning the capital’s rivers and major drains, marking a major step forward in modern water quality governance for the city. With pollution levels in urban rivers and drains varying significantly throughout the day, periodic sampling often fails to capture the complete picture. To address this challenge, a network of Online Monitoring Stations (OLMS) is being deployed across 41 strategic locations; 6 river monitoring sites and 35 major drains across Delhi. This makes it one of the most extensive river and drain monitoring networks deployed in any Indian city to date, covering key stretches of the River Yamuna and the major drains that feed into it. Each station is equipped with advanced sensors and instrumentation to continuously measure critical environmental parameters. The 6 river stations and  35 drain stations monitor Flow, pH, BOD, COD, TSS, Total Nitrogen, Total Phosphorus, Total Organic Carbon (TOC),  Ammonium, Dissolved Oxygen, Temperature, and Conductivity, providing a comprehensive picture of pollution load across Delhi’s water bodies. Each OLMS unit is solar-powered, housed in a dedicated cabin, and supported by IoT-enabled communication and centralized analytics, ensuring uninterrupted operation and instant data accessibility even at remote locations. Designed in accordance with CPCB guidelines and backed by 5 years of operations and maintenance, the network will provide actionable environmental intelligence, remote accessibility, and enhanced visibility into pollution trends across Delhi. By transforming fragmented monitoring data into actionable monitoring insights, the network is expected to enhance pollution load assessment, improve spatial and temporal understanding of waterbody dynamics, and support evidence-based regulatory and operational decision-making at scale.

Online Water Monitoring Systems
Blogs, Water Quality Monitoring

Why Industries Are Moving Towards Online Water Monitoring Systems

Water has quietly become one of the most regulated and most scrutinised inputs in Indian industry. Plants that once treated water management as a back-end utility now face direct pressure from regulators, rising input costs, and public attention on discharge quality. In response, a growing number of factories, treatment plants, and process facilities are replacing periodic manual sampling with Online Water Monitoring Systems that report water quality continuously instead of in batches. The shift is not about technology for its own sake. It is driven by specific operational and compliance gaps that manual testing can no longer close. The Problem With Sampling on a Schedule Conventional monitoring depends on grab samples collected at fixed intervals and sent to a laboratory. Results return a day or two later, by which time the conditions that produced them have usually changed. A single sample describes one location at one moment. It says nothing about what happened overnight, during a shift change, or when an effluent valve was briefly opened. For industries, that gap carries real consequences. An off-hours discharge exceedance can go unrecorded until the next scheduled sample. A drop in treatment performance can continue for hours before anyone notices. Because corrective action only begins after lab confirmation, most responses are reactive, and the cost of a missed event arrives as a penalty, a shutdown, or reputational damage. What an Online Water Monitoring System Actually Does An Online Water Monitoring System measures water quality directly in the process or discharge stream and transmits the data continuously to operators and, where required, to regulators. A working setup combines multi-parameter sensors, a data logger or remote telemetry unit, a communication link, and a cloud or SCADA platform. Sensors track key water quality and process parameters including flow, pH, TSS, COD, ammoniacal nitrogen, dissolved oxygen, TOC (where applicable), conductivity, turbidity, nitrate, and other application-specific indicators. Where required, BOD values are estimated using surrogate correlations or specialised analysers. Communication can be established through GSM/4G/5G, Ethernet, fibre, radio telemetry, LoRaWAN, or satellite networks depending on site conditions and regulatory requirements. The platform compares each reading against defined limits and raises an alert the moment a threshold is crossed. Why Industries Are Making the Move Regulation is the strongest single driver. Since CPCB’s OCEMS directives, industries classified under 17 Highly Polluting Industry (HPI) sectors have been required to install Online Continuous Effluent Monitoring Systems (OCEMS) and transmit real-time data to CPCB and State Pollution Control Board servers. For these plants, online monitoring is no longer optional, and the systems must stay calibrated and connected to remain compliant. Beyond compliance, water is getting expensive and scarce. Continuous monitoring provides confidence in treated water quality, enabling industries to safely reuse water for cooling towers, utilities, process applications, landscaping, and other non-potable purposes. Continuous visibility also lowers risk. Live data shows exactly which stage of a process is drifting, so operators can intervene before a parameter breaches its limit. When something does go wrong, a complete time stamped record helps separate a genuine process fault from a sensor event and supports any conversation with a regulator. Water performance has also become part of how companies report on sustainability. Verifiable, continuous discharge data carries far more weight with auditors and stakeholders than a folder of periodic lab reports. Where It Is Being Deployed Industrial effluent treatment plants form the largest use case, particularly in sectors named under the OCEMS mandate such as chemicals, pharmaceuticals, textiles, sugar and distillery, pulp and paper, and power generation. The technology is widely deployed across ETPs, CETPs, STPs, cooling water systems, and ZLD plants to support continuous compliance and operational control. Within industrial facilities, the same architecture enables process water monitoring, boiler and cooling water management, inlet water quality checks, and discharge monitoring where water quality directly affects process efficiency and product quality. Utilities and municipal operators apply these systems across treatment plant outlets, distribution networks, raw water intake monitoring points, and river monitoring stations to maintain visibility over water quality and ensure regulatory compliance. What to Plan For Before Deployment Online monitoring stays reliable when a few practical points are handled early. Sensor selection should match the actual water matrix, since effluent with high solids or aggressive chemistry fouls probes faster and needs more frequent service. Calibration is not a one time task, and most parameters need verification against laboratory standards every 30 to 90 days. Communication should suit the site, with cellular for connected locations and LoRaWAN or satellite for remote ones. Where regulatory transmission is required, the integration path to CPCB and state board servers should be confirmed before installation rather than after. Integrated Monitoring, Telemetry, and Compliance Infrastructure Aaxis Nano provides integrated solutions for continuous water quality monitoring by combining online instrumentation, telemetry, and SCADA connectivity. Multi-parameter sensors from partners such as s::can and ATi deliver real-time measurements, while the Telepro platform enables data visualization, alarm management, historical trending, and automated reporting. The solution supports seamless integration with plant SCADA systems and regulatory reporting platforms, including CPCB and SPCB servers where required. From system design and commissioning to calibration and maintenance, Aaxis Nano helps ensure reliable monitoring, data integrity, and long-term compliance performance. FAQs Q1. Is an online water monitoring system mandatory for my plant? If your facility falls under one of the 17 highly polluting industry categories defined by CPCB, an Online Continuous Effluent Monitoring System with live data transmission to CPCB and state board servers is a regulatory requirement. Many other plants adopt it voluntarily for process control and water reuse. Q2. How accurate are online sensors compared with laboratory testing? For most regulated parameters, modern sensors perform close to laboratory methods when properly calibrated. Routine verification against lab standards every 30 to 90 days keeps readings reliable. Complex parameters such as heavy metals may still need laboratory confirmation. Q3. What ongoing maintenance do these systems need? Typical upkeep includes periodic probe cleaning, calibration checks, inspection of the communication link, and replacement of consumable sensor parts. Effluent with high solids or

MetriNet Water Quality Monitor
Blogs, Water Quality Monitoring

MetriNet Multiparameter Water Quality Monitor: Features, Parameters and Applications

Water quality can change after treatment as it travels through reservoirs, pipelines, and distribution networks. Traditional grab sampling only provides periodic snapshots, making it difficult to identify sudden changes in chlorine residual, turbidity or contamination events. The MetriNet Multiparameter Water Quality Monitor provides continuous, real-time monitoring at critical points throughout the network, helping utilities maintain water quality from plant to consumer. What the MetriNet Water Quality Monitor Is MetriNet is a modular multi-parameter monitoring system from ATi, deployed in India by Aaxis Nano. Instead of one large analyser, it uses a network of small digital sensors called M-Nodes that plug into a shared communication bus. The system scales from a single sensor at a reservoir outlet to a distributed mesh across a city network, all feeding a central platform. Core Features The controller supports up to 8 M-Node sensors holding over 300,000 values, roughly 30 days of readings for 8 sensors at a one-minute interval. That local buffer matters in Indian field conditions, since data stays preserved on an internal card even when the link drops. Connectivity is flexible, with options for cellular, Wi-Fi, wired Modbus, Ethernet/IP, and Profibus DP, fitting both SCADA rooms and standalone remote sites. Built-in diagnostics, calibration reminders, and two alarm set points cut the manual attention each station needs. Using click-connect flow cells, sampled water can be returned to the main for effectively zero wastage when there is a small pressure difference between inlet and outlet, a practical advantage for utilities already fighting losses. Parameters It Measures The M-Node range covers the parameters most relevant to drinking water and distribution network monitoring. Per the product specification, MetriNet measures pH, pressure, turbidity, conductivity (2E/4E), dissolved oxygen (DO), oxygen reduction potential (ORP), nitrite, fluoride, free chlorine (FCI), total chlorine (TCI), combined chlorine, chlorine dioxide, dissolved ozone, hydrogen peroxide, peracetic acid (PAA), and other application-specific water quality parameters, enabling comprehensive real-time monitoring across water treatment and distribution systems. Free chlorine and turbidity are the priority pair for distribution monitoring, since a fall in residual chlorine or a turbidity spike often signals conditions where contamination follows. pH and conductivity add context, and the remaining parameters suit specific industrial or treatment applications. How the System Works At the centre of the system are the M-Nodes, complete digital sensors and transmitters in miniaturised bodies that connect in series. Each node is a Modbus smart transmitter that plugs directly into a MetriNet controller or any compatible data gathering system. For portable use, the Q51 controller runs and calibrates individual M-Nodes over Modbus RTU. For fixed installations, the MetriNet User Interface connects up to 8 nodes, logs data locally, and pushes it onward through IP-67 rated connectors. Nodes can be added or removed without disturbing the rest of the system, and because zero and span data sit inside each node, a freshly calibrated sensor swaps in within minutes. Applications The modular build lets one platform serve very different needs: Drinking water distribution: nodes track chlorine, turbidity, and pH, flagging loss of disinfection or discolouration early. Leak and network management: Water quality data can be integrated with pressure and leak monitoring systems to support network management decisions  Industrial and process water: in food and beverage and power generation, where quality affects the product. Healthcare and high-risk systems: renal dialysis water, HVAC circuits, and Legionella-sensitive applications needing continuous assurance. Built for Continuous Water Quality Surveillance MetriNet is engineered to provide continuous visibility into water quality across the distribution network. Its low-power digital M-Node sensors support long-term deployment at remote monitoring locations, while onboard data logging ensures measurement records remain available during temporary communication interruptions. The modular architecture enables utilities to expand monitoring coverage as operational requirements grow. Deployment, Integration and Operational Support Aaxis Nano supports the implementation of MetriNet monitoring systems through application assessment, monitoring point identification, sensor configuration, communication setup, and data integration. The system can be incorporated into existing SCADA, PLC, and telemetry infrastructures, enabling real-time data acquisition, visualization, historical trending, and alarm management. Through structured commissioning, calibration services, and preventive maintenance programs, utilities can maintain measurement accuracy, system reliability, and long-term monitoring performance across the distribution network. FAQs How many parameters can it measure? The M-Node range offers up to 16 parameters, and a single controller accepts up to 8 sensors at once. Operators choose only what a site needs, including pH, free chlorine, turbidity, conductivity, dissolved oxygen, and ORP. What happens if the network connection drops? Each controller stores over 300,000 values locally, about 30 days for 8 sensors at one minute intervals, and transmits once the link is restored. Can sensors be replaced without shutting the system down? Yes. M-Nodes plug into a shared bus and can be added or removed without affecting other measurements, and because calibration data sits in each node, a pre-calibrated sensor swaps in on site within minutes.

Blogs, Water Quality Monitoring

Automated Oil Spill Detection Systems: Technologies, Applications & Regulatory Requirements

Oil behaves differently from any other water pollutant. A small release spreads into a thin film within minutes, drifts with wind and current, and can foul a long stretch of shoreline or a water intake before anyone notices. The cost of a spill is set largely by how fast it is caught, which is why an automated oil spill detection system for water has become standard at refineries, ports, and offshore sites.  The Detection Challenge Oil on water is harder to monitor than it sounds. A sheen only microns thick can still be a reportable event, yet it stays invisible to most general water sensors. Detection must also work at night, in fog, and against the clutter of waves, rain, and biological films that mimic an oil signature. A useful system flags a release early, points to its source, and avoids false alarms. Detection Technologies No single sensor covers every situation, so most sites combine a few: Fluorescence sensors are the workhorse for fixed point monitoring. Oil fluoresces under ultraviolet light, and an in-water probe reads that response to flag hydrocarbons at an intake or outfall continuously, often down to parts per billion. Surface film detectors sit at the waterline and read the change in reflected or absorbed light caused by an oil layer, suiting harbours and basins where a floating slick is the main concern. Laser fluorosensors take this further by using pulsed ultraviolet laser technology to detect and characterize oil remotely without direct contact with the water surface. Unlike conventional point sensors, they can monitor larger areas, rapidly localize spills, and help distinguish hydrocarbons from many naturally occurring surface films. This makes them particularly valuable for ports, terminals, offshore platforms, and environmentally sensitive water bodies where early detection over a wider area is critical. Aaxis Nano deploys this class of technology through its partnership with LDI. Radar covers wide areas. Oil damps the surface ripples radar normally sees, so a slick appears as a dark patch. Marine X-band radar watches the zone around a terminal, while satellite radar maps large offshore spills. Infrared and camera systems add visual confirmation. Thermal contrast between oil and water, combined with automated image analytics, helps verify alarms and track the movement of a slick in real time. Applications The technology choice follows the setting. Refinery and petrochemical outfalls use fluorescence sensors to confirm that treated effluent stays oil free, since a process upset can carry hydrocarbons into a drain. Ports and harbours combine surface detectors and radar to catch bunkering spills and bilge releases, while offshore platforms rely on radar and camera systems to watch the wide, unlit area around the structure. Water intake protection is a growing use. Power plants, desalination units, and drinking water works drawing from rivers or the sea install detection upstream of the intake to close a gate before oil reaches the plant, and inland pipelines crossing rivers use fixed detectors to catch a leak before it travels downstream. Regulatory Requirements Two layers of regulation drive adoption in India. For shipping, MARPOL Annex I sets a hard limit: machinery space bilge water may be discharged only if its oil content stays under 15 ppm, enforced by oil filtering equipment with an automatic stopping device. That single threshold drives much of the onboard and terminal monitoring in use.For spills in Indian waters, the National Oil Spill Disaster Contingency Plan (NOSDCP) designates the Indian Coast Guard as the Central Coordinating Authority for oil spill response. Ports, oil-handling facilities, and offshore operators are responsible for responding to incidents within their areas of operation, while the Coast Guard coordinates larger or more complex spill response efforts requiring multi-agency support. Domestic environmental regulations and discharge consent conditions also place limits on oil and grease concentrations in industrial effluent, making continuous detection a compliance tool as much as a safety measure. How an Automated Oil Spill Detection System Works How Aaxis Nano Supports Implementation Implementing an effective oil spill detection system requires more than selecting the right sensor. Factors such as site conditions, monitoring objectives, communication infrastructure, and response requirements all influence system performance. Aaxis Nano supports these implementations by combining advanced sensing technologies, including LDI laser fluorosensors, with telemetry, SCADA integration, and the Telepro platform to deliver continuous monitoring, real-time alerting, and operational visibility. From site assessment and sensor selection to commissioning and integration with existing monitoring and emergency response systems, the focus is on ensuring that detection data translates into actionable response workflows. This enables faster spill containment, reduced environmental impact, and stronger regulatory compliance. FAQs How does a sensor detect oil in water? Most fixed systems use fluorescence: oil glows under ultraviolet light, and the sensor measures that response to detect hydrocarbons, often at parts per billion, without contact with the slick. Radar and infrared methods add wide-area and night-time coverage. What is the 15 ppm rule? Under MARPOL Annex I, oily bilge water from ships may be discharged only if its oil content is below 15 parts per million, and the filtering equipment must stop the discharge automatically above that level. Who is responsible for oil spill response in Indian waters? The Indian Coast Guard, under the National Oil Spill Disaster Contingency Plan. Response is tiered, with ports, terminals, and operators handling smaller spills and the Coast Guard coordinating major incidents. Can oil spill detection systems be integrated with SCADA and automation platforms? Yes. Modern oil spill detection systems can be integrated with SCADA, telemetry, and control platforms to generate alarms, send notifications, trigger equipment shutdowns, close intake gates, and maintain event logs for regulatory reporting and audit purposes.

Chhattisgarh Water Governance
Case Studies

Chhattisgarh Redefines Water Governance through digital oversight of State Water Resources

Governing water at scale is as much a test of visibility as it is of infrastructure. Difficulty in capturing water levels across dispersed terrains, integrating the new system with existing e-SWIS and WRD infrastructure, ensuring consistent data quality made the imperative for a system Monitoring River and reservoirs continuously, capturing rainfall and surface water data in real-time, supporting flood forecasting, providing validated datasets for planning, modelling and reporting. This is where Aaxis came to rescue. Turning Insight into Actions Aaxis deployed a carefully selected suite of RTDAS, combining advanced instrumentation and resilient infrastructure, telemetry and integrated analytics, purpose built for large-scale, long-term hydrological monitoring. Automatic Weather Station to measures 6 parameters, temperature, Relative humidity, wind speed, wind direction, atmospheric pressure and precipitation. Deployment of AWLRs1 , ARGs2 , ATRH Probe3 , Shaft Encoder4 , Evaporimeter5 and Pyranometer6 . Secure GSM/GPRS and INSAT- based communication to ensured uninterrupted data transmission from remote, unattended sites. Integrated Software and Analytics Platform, interfaced with WRD’s e-SWIS , enabling configuration, calibration, validation and realtime visualization at the state data centre . Chhattisgarh is drained by 4 major river systemsGanga, Mahanadi, Narmada and Godavari with total flood-affected area estimated at 12,029 hectares. To address the technical requirements, the WRD partnered with Aaxis Nano to implement a statewide a Real-Time Data Acquisition System, delivering a 360o monitoring solution across 160 strategic locations spanning the Mahanadi, Godavari , Ganga and Brahmani River basins. Redefined Operational Control Delivered on time with WRDcertification, the project translated complexity into clarity, enabling statewide Real-time monitoring. The project transformed intricate hydrological data into lucid insights. Continuous real-time analysis enhanced flood preparedness, refined river and reservoir management, and guided geological planning, while automated systems bridged gaps and minimized human errors, empowering governance that is informed, proactive and decisively risk-ready. Aaxis Nano operates in dialogue with the environment, adapting to terrain, weather and ecology to honour its long-term responsibility. By unifying instrumentation, telemetry analytics and long-term stewardship, Aaxis Nano emerged not merely as a solution provider but as a strategic partner- strengthening Chhattisgarh’s water resilience. Automatic Water Level Recorders (AWLRs) -SOM-L30 by Sommer Automatic Rain Gauges (ARGs)- TB3 by Hyquest Solution ATRH Probe – RHT175 by Microstep- MIS Shaft Encoder- AD375MA by Hyquest Solutions Evaporimeter-Evap TSP by Microstep- MIS Pyranometer- SP Lite 2 by Hach OTT Photo Gallery

Case Studies

DPCC Strengthens Delhi’s Air Quality Monitoring Network

6 NEW CAAQMS STATIONS LIVE IN DELHI DPCC Strengthens Delhi’s Air Quality Monitoring Network 10 June 2026  |  Delhi Secretariat, India Enabled by Aaxis Nano’s integrated environmental monitoring and analytics capabilities, the CAAQMS network delivers real-time surveillance, automated reporting, and data-driven air quality management across Delhi. Six Continuous Ambient Air Quality Monitoring Stations (CAAQMS) were commissioned across Delhi, expanding the city’s real-time air quality monitoring network. The stations continuously monitor key pollutants including PM₂.₅, PM₁₀, NOx, CO, SO₂, O₃, NH₃ and BTEX, alongside critical meteorological parameters, generating validated environmental data every 15 minutes. Enabled by IoT-based communication and centralized analytics, the network supports real-time monitoring, AQI assessment, trend analysis, data comparison across locations, automated reporting, and direct CPCB server connectivity—strengthening data-driven environmental management and regulatory compliance across Delhi. Aaxis Nano executed the project on a turnkey basis, taking responsibility for the entire lifecycle—from supply and commissioning to operations and maintenance.  By combining environmental monitoring expertise with automation, IoT, and data analytics capabilities, the company provides integrated solutions that extend beyond equipment deployment to ensure reliable performance, data integrity, and long-term operational support. As urban air quality continues to remain a key environmental concern, the addition of six new monitoring stations marks a significant step towards building a more connected, data-driven, and responsive air quality management framework for Delhi.

UV Disinfection Systems for Water Treatment
Blogs, Water Quality Monitoring

UV Disinfection in Municipal Water Treatment: Why Utilities Are Moving Beyond Chlorination

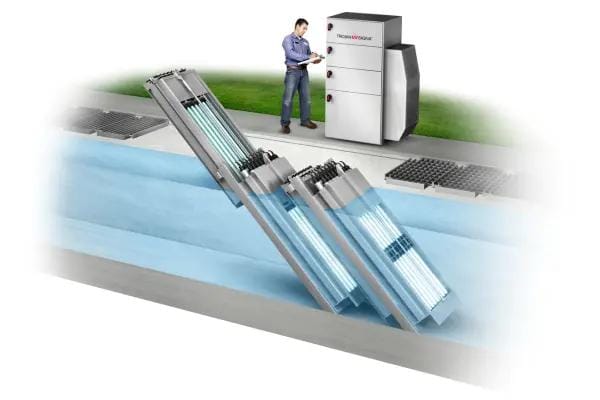
Municipal water utilities today face a growing challenge: delivering safe drinking water while reducing chemical dependency, operational risk, and environmental impact. As cities expand and source water quality becomes more variable, utilities are moving beyond conventional chlorination alone and adopting advanced disinfection technologies that provide faster and more reliable pathogen control. One technology gaining widespread adoption is UV disinfection. By using ultraviolet light to inactivate harmful microorganisms without adding chemicals to the water, UV systems help utilities strengthen microbial protection, reduce disinfection by-products, and support regulatory compliance. Today, many of the world’s leading treatment facilities use UV as a critical barrier within a multi-stage treatment process. Why Conventional Chemical Disinfection Alone Has Limitations Chlorination continues to play an important role in water treatment because it provides residual protection throughout the distribution network. However, relying solely on chemical disinfection can present several operational and water-quality challenges.  Certain chlorine resistant pathogens such as Cryptosporidium and Giardia can survive standard chlorination doses. Chemical disinfection can also produce unwanted disinfection byproducts like trihalomethanes (THMs) and haloacetic acids (HAAs), especially when source water contains high organic content. In addition, chemical dosing systems require continuous handling, storage, and monitoring of hazardous substances. Variations in pH, turbidity, and organic load can also affect disinfection efficiency, making process control more complex for utilities operating large scale treatment networks. UV disinfection addresses many of these limitations by providing rapid microbial inactivation without altering the chemical composition of water. What is UV Disinfection? UV disinfection uses ultraviolet light, typically at a wavelength of 254 nanometres, to deactivate microorganisms by damaging their DNA and RNA structures. Once exposed to sufficient UV energy, bacteria, viruses, and protozoa lose their ability to reproduce and infect consumers. Unlike chemical disinfectants, UV treatment does not introduce additives into the water and does not generate harmful residual by-products under normal operating conditions.  Modern municipal UV systems are commonly installed after filtration processes and before final water distribution. In many treatment plants, UV acts as a primary disinfection barrier while chlorine provides secondary residual protection within the pipeline network. Core Components of a Municipal UV System A typical UV disinfection installation consists of several integrated components working together for controlled and validated pathogen inactivation. UV Reactors Water flows through stainless-steel reactor chambers containing multiple UV lamps arranged to maximise exposure throughout the flow path. Modern reactor designs are engineered to deliver consistent UV dose distribution even under varying flow conditions. UV Lamps Municipal systems typically use either Low-Pressure High-Output (LPHO) lamps or Medium-Pressure lamps. LPHO systems are known for their energy efficiency and longer operating life, while Medium-Pressure systems can deliver higher intensity output within a more compact footprint.  Quartz Sleeves UV lamps are enclosed within quartz sleeves that isolate electrical components from water while allowing maximum UV transmission. Maintaining sleeve cleanliness is essential for long-term performance.  UV Intensity Sensors Online sensors continuously monitor UV dose intensity to verify that disinfection performance remains within validated operating conditions. Control and Automation Systems Modern UV installations are closely integrated with PLC, SCADA, and telemetry platforms. Operators can monitor lamp performance, UV intensity, flow rates, alarms, and maintenance schedules in real time, enabling faster response to operational issues and improved process control. How UV Disinfection Works After coagulation, sedimentation, and filtration, water enters the UV reactor, where UV-C light damages microbial DNA, preventing replication. UV treatment effectiveness depends on: UV intensity Exposure time Water transmittance Modern UV systems automatically adjust lamp output based on flow and water quality, maintaining reliable disinfection while reducing energy use. Many municipal systems are validated to meet regulatory pathogen reduction requirements across a range of operating conditions, providing an added layer of treatment assurance. Key Advantages of UV Disinfection Effective Against Chlorine Resistant Pathogens UV systems are highly effective against Cryptosporidium and Giardia, which are difficult to fully control through chlorination alone. This makes UV particularly valuable for surface water treatment plants exposed to biological contamination risk. No Chemical Byproducts Since UV treatment does not involve oxidation reactions like chlorine, it significantly reduces the formation of THMs and HAAs, helping utilities meet stricter drinking water standards. Rapid Disinfection Microbial inactivation occurs within seconds as water passes through the reactor, enabling high throughput operation without large contact tanks. Improved Safety UV systems reduce dependence on hazardous chemical storage and handling, lowering operational risk for plant personnel. Compact Installation Compared to large chemical contact basins, UV reactors require relatively small installation footprints, making them suitable for both new plants and retrofit projects. Operational Challenges and Design Considerations Although UV disinfection offers significant advantages, system performance depends heavily on proper design and maintenance. Water Quality Dependence High turbidity, suspended solids, iron, manganese, and organic matter can reduce UV transmittance and shield microorganisms from exposure. Effective pretreatment is therefore essential. Lamp Fouling Mineral scaling and biofilm accumulation on quartz sleeves reduce UV transmission efficiency over time. Automatic mechanical or chemical cleaning systems are commonly used to maintain performance. Energy Consumption UV systems require continuous electrical power for lamp operation. Energy optimization strategies include variable lamp output control and reactor staging based on flow demand. No Residual Protection Unlike chlorine, UV leaves no residual disinfectant within the distribution network. Most municipal systems therefore use UV alongside low level chlorination or chloramination for downstream protection. Applications in Municipal Water Treatment UV disinfection is widely deployed across multiple municipal treatment scenarios: Surface water treatment plants Groundwater treatment facilities Recycled water and wastewater reuse projects Desalination plants Rural and decentralized drinking water systems Smart water infrastructure upgrades Large scale utilities increasingly integrate UV performance monitoring into centralized SCADA systems for real time operational visibility and compliance reporting. Industry Evolution Modern UV systems are becoming more intelligent and energy efficient through digital monitoring and automation. Advanced reactors now use real time UV transmittance compensation, predictive maintenance analytics, and remote performance diagnostics. Utilities are also integrating UV systems into broader smart water management platforms, combining water quality monitoring, hydraulic analytics, and automated reporting into unified operational dashboards. With tightening regulatory requirements and growing emphasis

Scroll to Top