visu::tool
visu::tool is a fast and easy-to-use data visualization software for PCs and notebooks. In 3 simple steps, you can visualize huge amounts of data from con::cube or con::lyte into single or multiple graphs. The visu::tool “lyte” version is available for free download. The advanced visu::tool “pro” version includes a vast amount of additional useful offline features such as data aggregation, fingerprint plots, and parameter correlation and is now available for sale.
- Read s::can files (.log, .par, .csv, .xlsx, and .fp files)
- The graphical user interface for parameter selection
- Plot selected parameter or fingerprint data coming from your s::can probe
- Save data in Excel
- Create customized reports (sensor health report, drift detection, event detection)
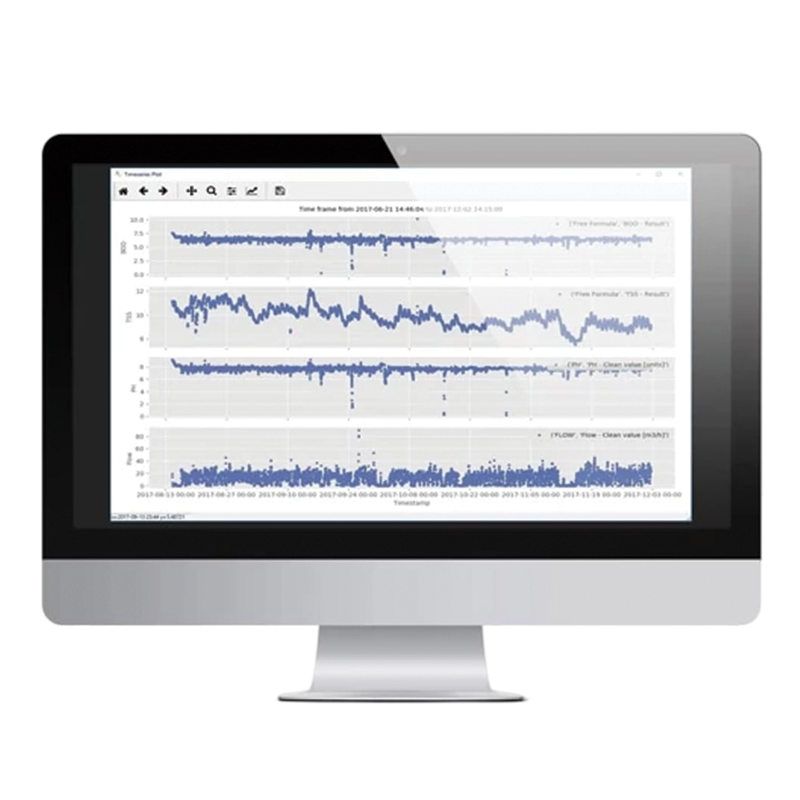
- Data Visualization:
Transforms complex sensor data (from devices like con::cube and con::lyte) into clear single or multi-graph displays for simplified interpretation. - Reporting:
Generates customizable reports covering sensor health, drift detection, and event detection, supporting proactive system management. - Data Export:
Enables quick export of datasets to Excel for deeper offline analysis. - User-Friendly Interface:
Offers an intuitive graphical user interface (GUI) for selecting parameters, analyzing measurements, and reviewing trends. - Advanced Analysis (visu::tool pro):
Includes enhanced tools like data aggregation and fingerprint plots for deeper insight and pattern recognition. - Integration:
Seamlessly integrates with Badger Meter’s smart water ecosystem, consolidating data from flow, pressure, and water quality sensors for comprehensive analysis.
- Potable Water Monitoring:
Ensures drinking water quality and regulatory compliance throughout distribution networks. - Wastewater Treatment:
Monitors key parameters (COD, BOD, TSS, Nitrate, etc.) across treatment stages to optimize processes and meet discharge standards. - Process Water Management:
Supports industrial operations by monitoring process water quality for efficiency, safety, and cost control. - Environmental Monitoring:
Tracks water conditions in natural bodies and industrial effluent to detect pollution and identify anomalies early. - Remote Location Monitoring:
Enables reliable data collection and analysis from remote or unmanned sites where continuous oversight is essential.
- Data Visualization:
Quickly plots measurement data such as UV-Vis spectra, turbidity, TOC, COD, and NO₃-N from s::can sensors. - Flexible Graphing:
Creates single or multi-parameter graphs in just a few steps for easy comparison and analysis. - Advanced Reporting:
Generates customized reports covering sensor health, drift detection, and event identification. - Data Handling:
Supports .log, .par, .csv, .xlsx, and .fp files, with the ability to export results to Excel. - Version Options:
Offered as a free lyte version and an advanced pro version with fingerprint plots, data aggregation, and correlation tools. - Hardware Integration:
Fully compatible with Badger Meter’s water quality monitoring instruments for seamless analysis.